

This post provides an in-depth overview of automatic interpretation of chest CT scans using machine learning, and includes an introduction to the new RAD-ChestCT data set of 36,316 volumes from 19,993 unique patients. The main reference for this post is my recent paper “Machine-Learning-Based Multiple Abnormality Prediction with Large-Scale Chest Computed Tomography Volumes” which describes the development and analysis of RAD-ChestCT, the largest volumetric chest imaging dataset in the world.
CT scans are large volumetric images, on the order of 512 x 512 x 1000 grayscale pixels, that depict the heart, lungs, and other anatomical structures in the chest. They are used in the diagnosis and management of a wide range of medical conditions including cancer, infections, and fractures. This post discusses how CT scans are acquired, how CT scans are interpreted, why automatic interpretation of CTs is challenging, and finally, how to use machine learning to automatically interpret CT scans.
What is a Chest CT Scan?
A chest CT depicts the chest, including the left lung, the right lung, the airways, the heart, and the great vessels:
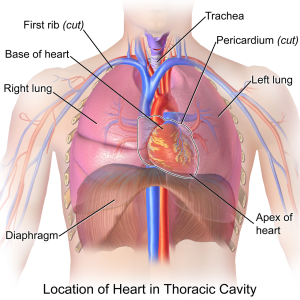
Image Source: Wikipedia
For a more detailed overview of chest anatomy, see this post.
Because chest CT scans are volumetric images, they can be viewed by scrolling through three different planes: the coronal plane, axial plane, and sagittal plane.
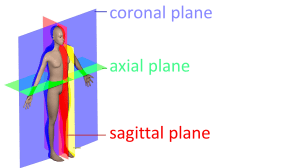
Modified from Wikipedia Anatomical Planes
Here is an example CT scan in the axial plane:

Here is another example CT scan in the axial plane:
For an example CT scan shown from all three different views, please see this article, which includes scrollable high-resolution CT images of a normal chest.
How is a CT Scan Obtained?
The following image shows a CT scanner, which is a donut-shaped instrument:
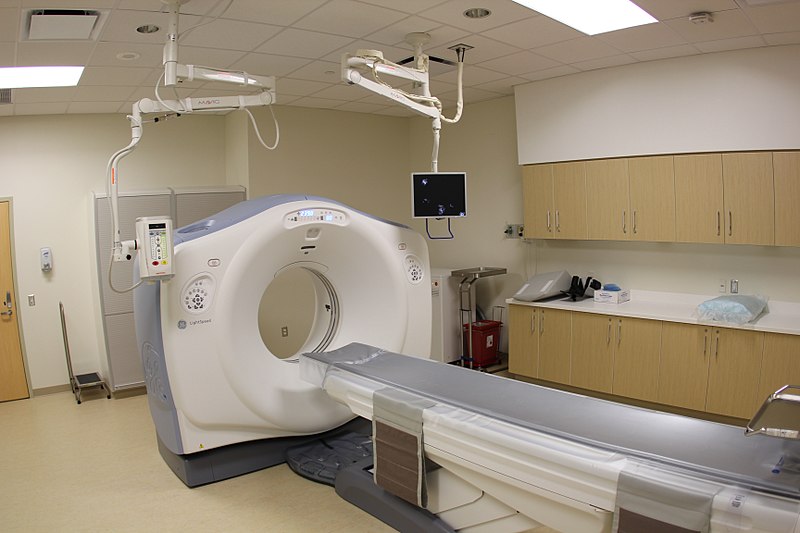
Image Source: Wikipedia
The patient lays down on the table and is moved through the “donut hole” of the CT scanner. Here is what the inside of the CT scanner looks like:
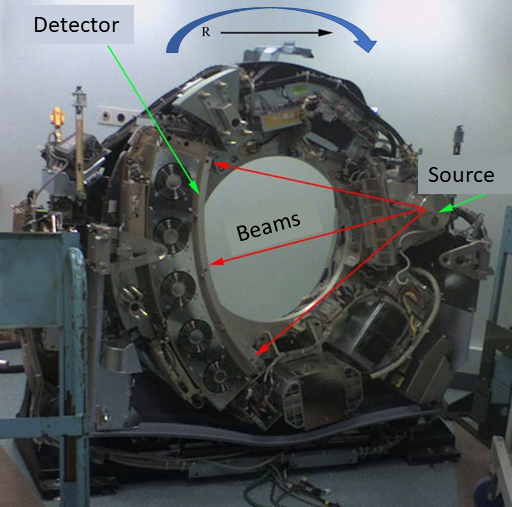
Image Source: modified from Wikipedia
CT scans are x-ray based. However, CTs are different from “projectional x-rays” because CT are 3D and projectional x-rays are 2D (automated projectional x-ray interpretation is overviewed here).
The CT scanner’s x-ray source sends beams of x-rays (shown in red above) through the patient’s body and onto a detector. The entire source/detector apparatus rotates around the patient as the patient passes through the center hole, so that measurements of the radiodensity of the patient’s body can be taken at many points in 3D space.
The final CT scan encodes the radiodensity of millions of points in the patient’s body using Hounsfield units, where air is shown in black and bone is shown in white. Tissues of intermediate density are shown in gray.
How does a radiologist interpret CT scans?
CT scans are a popular form of imaging and extremely useful for diagnosis and management of many diseases. A radiologist is a doctor who interprets medical images and writes up a descriptive report that is used by other doctors in patient care.
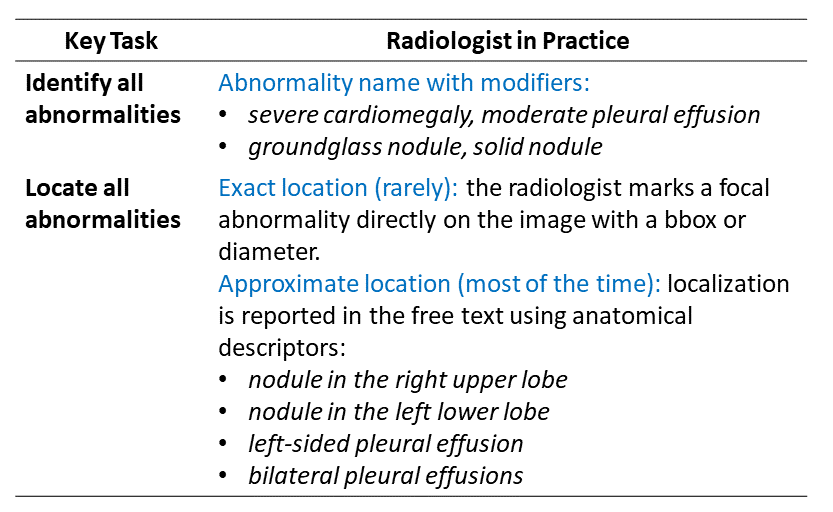
There are two main tasks that a radiologist performs to interpret a CT scan. First, the radiologist must identify what kinds of abnormalities are present – e.g. pneumonia (infected lung), atelectasis (collapsed lung tissue), cardiomegaly (enlarged heart), nodule, mass, pleural effusion (fluid in the lung space) and so on. Next, the radiologist must specify in their description where the abnormalities are located. Location is often medically important – for example, different kinds of lung cancer tend to be located in different places. This table summarizes the radiologist’s tasks:
Example CT Report
Here is an example chest CT report from National Diagnostic Imaging, where the text was copied from a publicly available example report that can be viewed here:
EXAM: CTA CHEST W W/O CONTRAST
CLINICAL HISTORY: SOB, dyspnea, R/O PE, ILD, possible occupational lung disease
INDICATIONS: 49 year-old patient with shortness of breath. Possible PE. Possible occupational lung disease.
PROCEDURE: Consecutive axial slices were obtained without and with intravenous contrast. Bolus thin slices were performed through the pulmonary arteries.
The pulmonary trunk shows no evidence for thrombus or embolus. There is no evidence for a saddle embolus. The right and left main pulmonary arteries appear unremarkable. The first and second order pulmonary branches bilaterally do not show evidence for embolus. The axillary regions show no adenopathy. The mediastinum and hilar regions show no masses or adenopathy. The included upper abdomen shows splenic calcification which could indicate remote granulomatous disease. There is some focal renal cortical thickening on the right where there may be prior scarring. There is no evidence for pulmonary parenchymal interstitial lung disease. On image 2 series 4 in the left lower lung there is a 3 mm nodule. This could be followed with surveillance CT in 12 months if there is further concern. There is also a small similar nodule on the same series image 49 on the left. There are no infiltrates or effusions. There is no acute bony abnormality seen.
IMPRESSION: No evidence for pulmonary embolic disease. Some small lung nodules on the left could be followed at 12 months with a CT if there is sufficient concern. No evidence for interstitial lung disease.
Why is automated CT interpretation an interesting and challenging task?
It is time-consuming for radiologists to craft these detailed reports for each CT scan. It is even more time-consuming when the patient has received multiple CT scans – for example, an initial scan and a follow-up scan 3 months later – because in this case the radiologist has to compare both scans side-by-side to understand how the patient’s health has changed. There is substantial interest in developing machine learning methods to automate interpretation of CT scans, to accelerate the radiology workflow and reduce the 3 – 5% real-time diagnostic error rate of radiologists.
Automated interpretation of CT scans is challenging for several reasons:
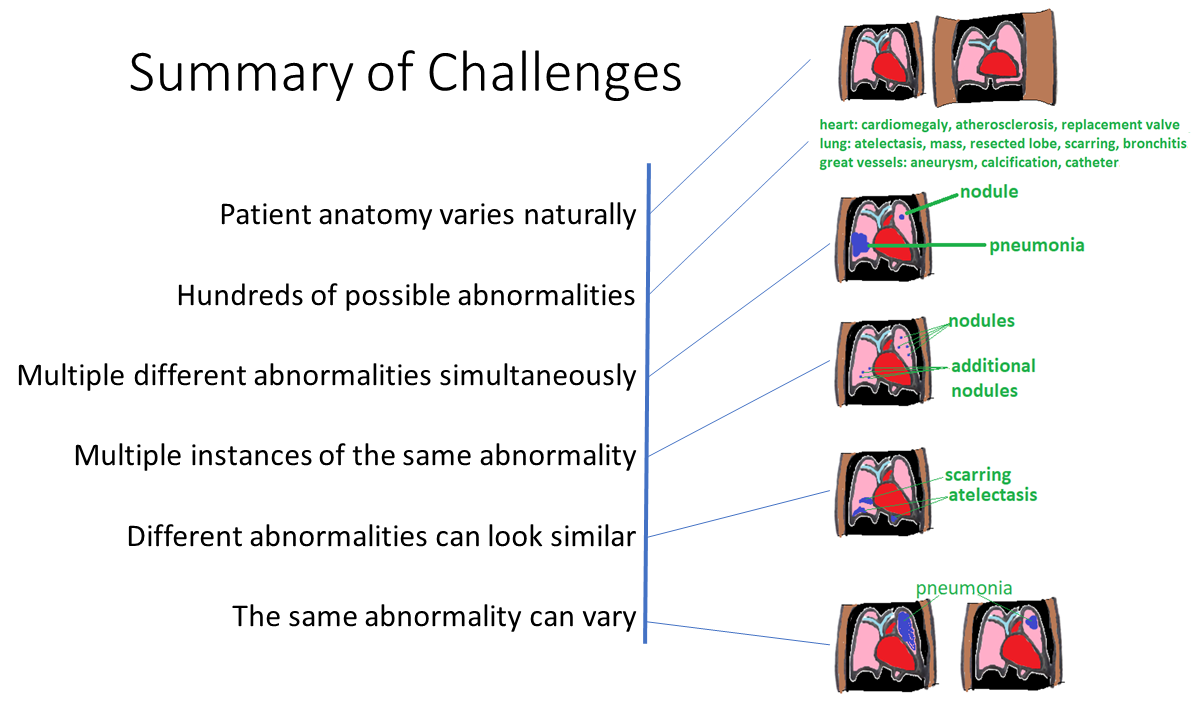
Challenge 1: Patient anatomy varies naturally based on gender, age, weight, and normal anatomical variants. Therefore “variation” does not necessarily connote “abnormality.”
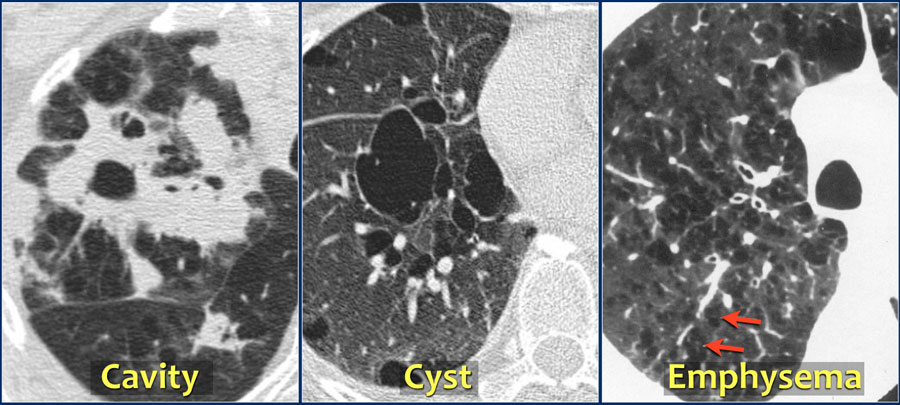
Challenge 2: There are hundreds of possible abnormalities. The figure below shows just a few examples, including eosinophilic pneumonia, a cavitary lesion (“hole”), a cyst, emphysema (the lungs become spongier e.g. due to smoking), pneumothorax (air pocket between the lungs and lung sac), and fibrosis (similar to scarring):
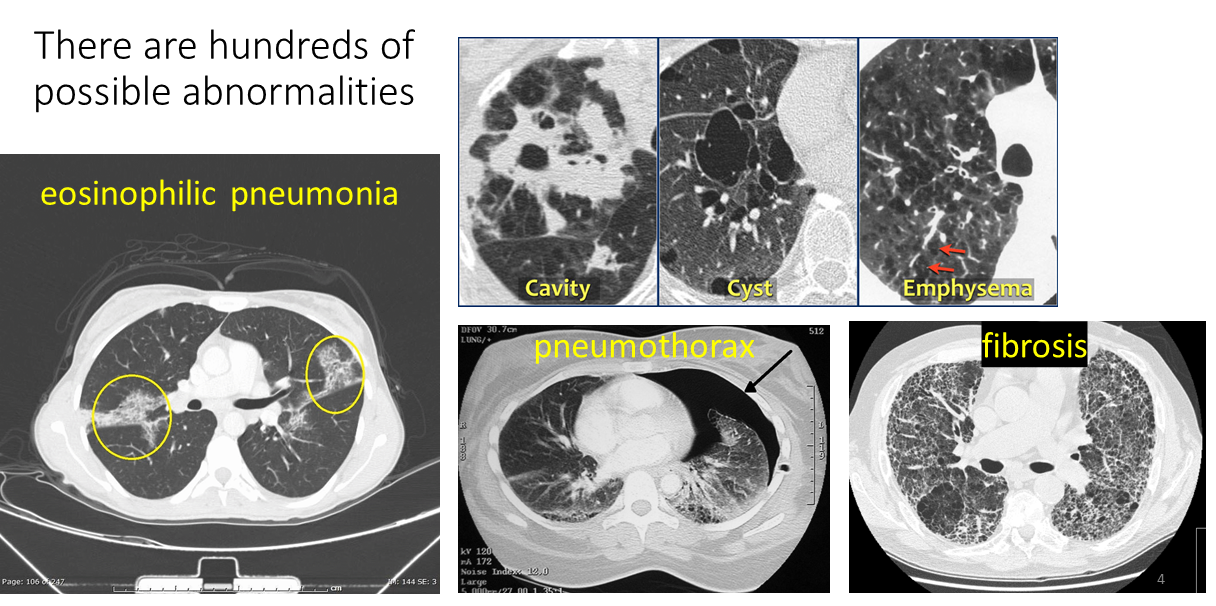
Modified from these original images: Eeosinophilic pneumonia WikiDoc. Cavity/cyst/emphysema RadiologyAssistant. Pneumothorax Wikipedia. Fibrosis Wikipedia
Challenge 3: Multiple different abnormalities are typically present in one scan. The average CT scan contains 10 +/- 6 different abnormalities. Shown below are a few examples of CT scan slices with more than one abnormality:
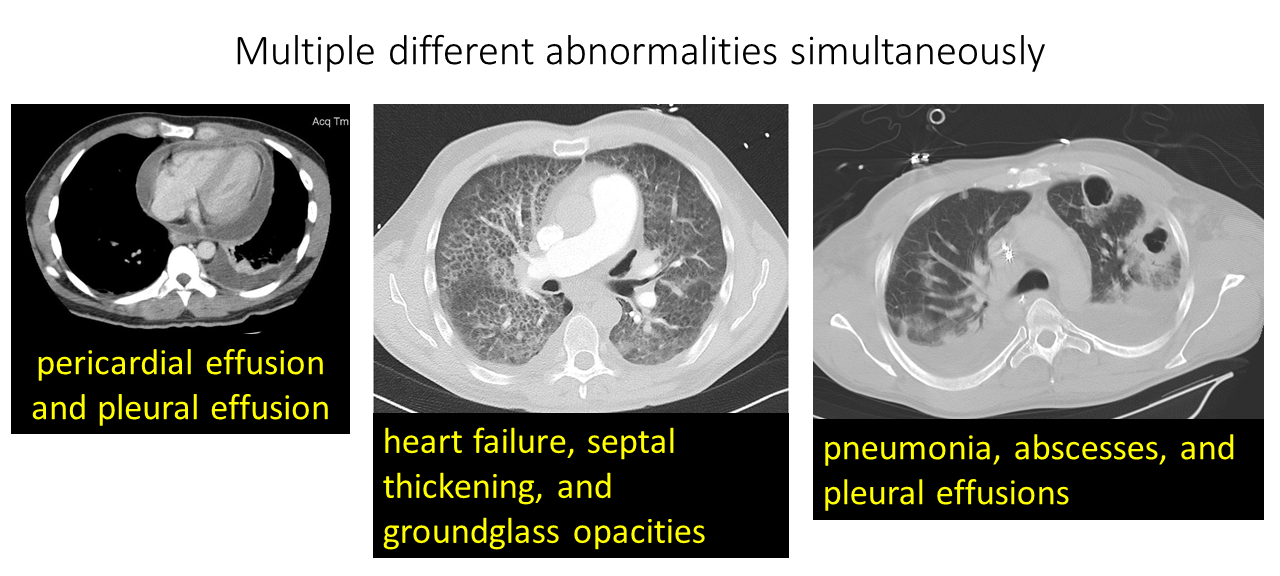
Modified from these original images: Pericardial effusion Radiopaedia. Pneumonia, abscesses Christaras A. Heart failure Radiopaedia
Challenge 4: Furthermore, there are frequently multiple instances of the same abnormality in one scan. Below, we can see a scan with multiple bullae (big air pockets) in emphysematous lungs, another scan full of nodules, and another scan with multiple masses:
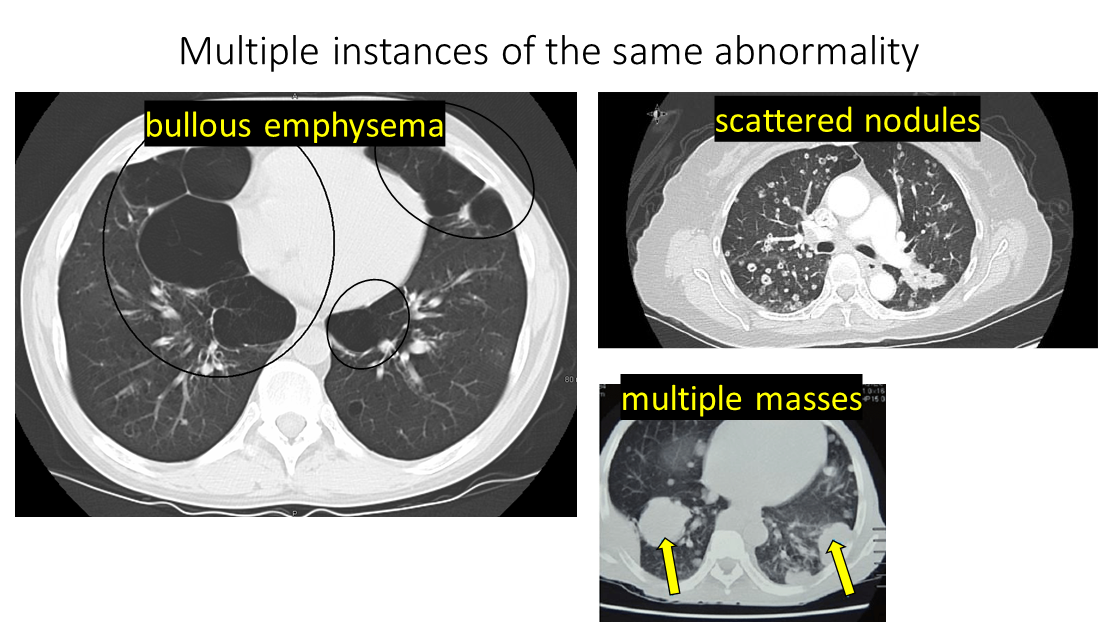
Modified from these original images: Emphysema TES.com. Nodules pulmonarychronicles. Masses ResearchGate
Challenge 5: Different abnormalities can look similar to each other. In these cases, the radiologist relies on their extensive training and the patient’s medical context to determine the nature of the abnormality. The scan below shows both a tumor (“TUM”) and atelectasis (“ATL”, collapsed lung tissue) which look similar in this scan:
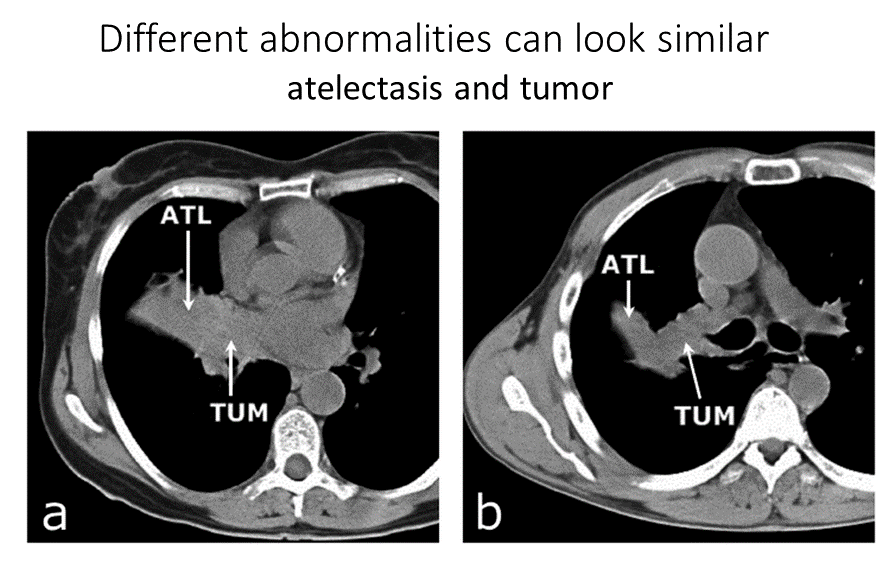
Image Source: atelectasis/tumor ResearchGate
Challenge 6: The same abnormality can vary in appearance. For example, the same abnormality will look different depending on severity, such as the pneumonia scans below where the scan on the left has an entire lung “whited out” by pneumonia while the scan on the right contains only a smaller part of the lung “whited out” by pneumonia:
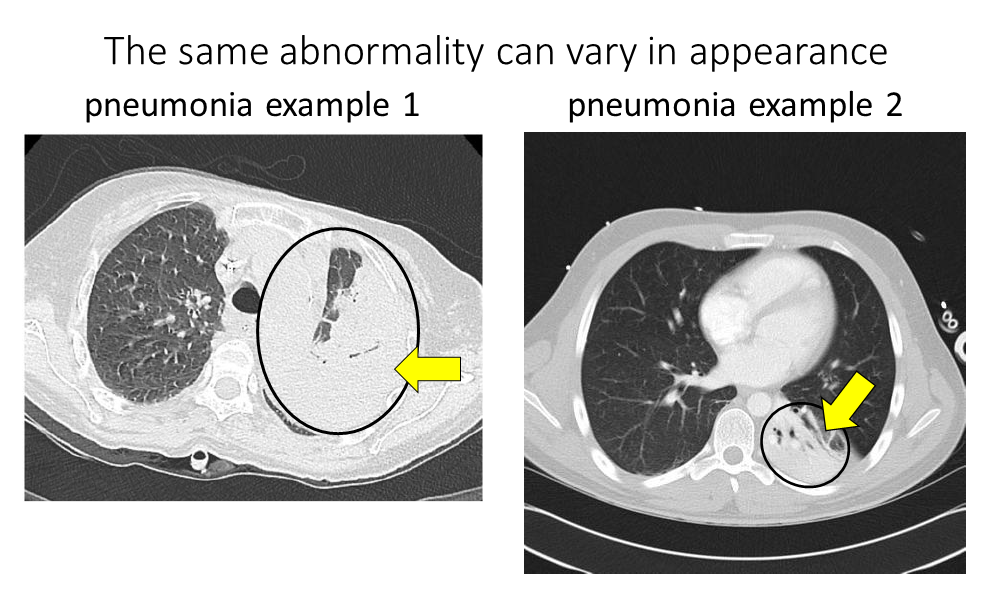
Modified from these original images: pneumonia example 1 Kalpana Bansal. Pneumonia example 2 Radiopaedia
It’s also possible for the same abnormality to look different depending on its shape and texture. The montage below shows lung nodules that all look different depending on their shape (e.g. lobulated, spiculated, round) and their texture (e.g. groundglass, solid):
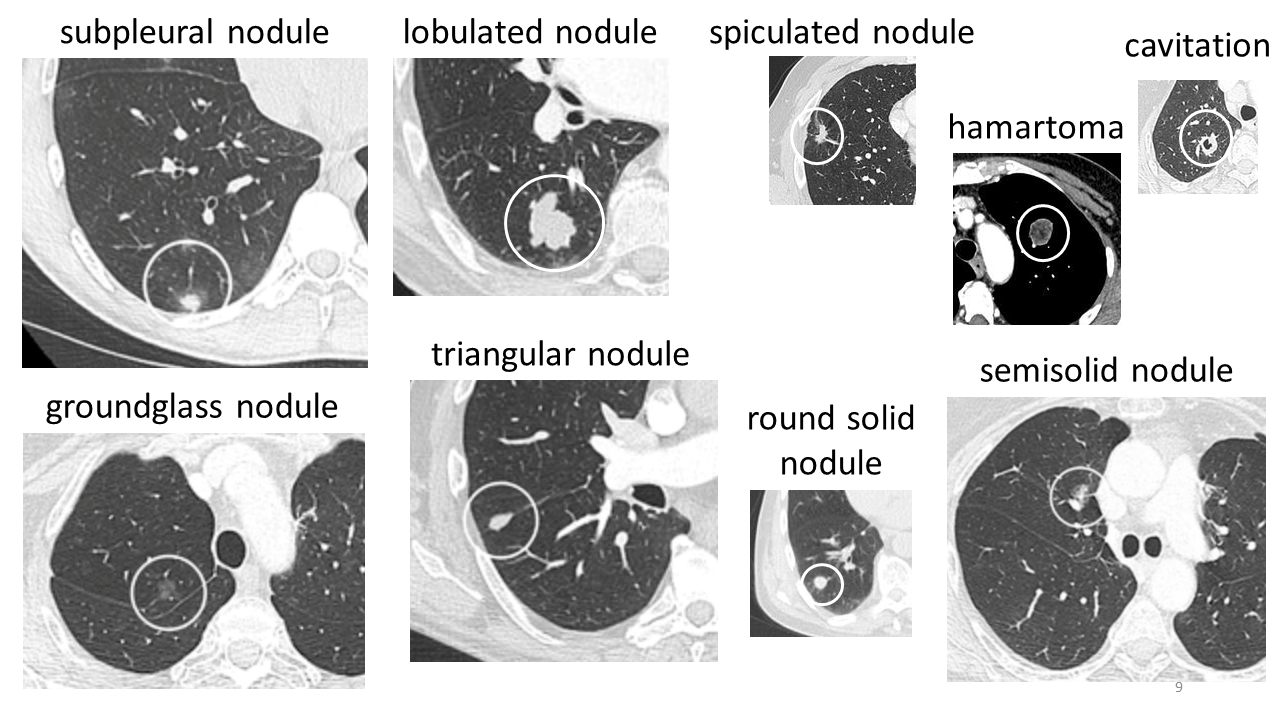
Modified from these original images: lung nodules Wikipedia
The following figure summarizes the challenges in automated CT interpretation:
How to Use Machine Learning for Automated CT Interpretation
In order to understand how to use machine learning for automated CT interpretation it is important to first consider what kind of data is available to train the models.
Healthcare systems save the CT volume paired with the corresponding CT report:

Some patients will have only one CT volume and report, like patient 000000 in the figure above. Other patients will have multiple CT volumes and reports. These multiple CT volumes may have been taken at different times and/or may be of different parts of the body (although this post is focused on chest CTs, it is also possible to get CTs of the head, abdomen, pelvis, and other regions).
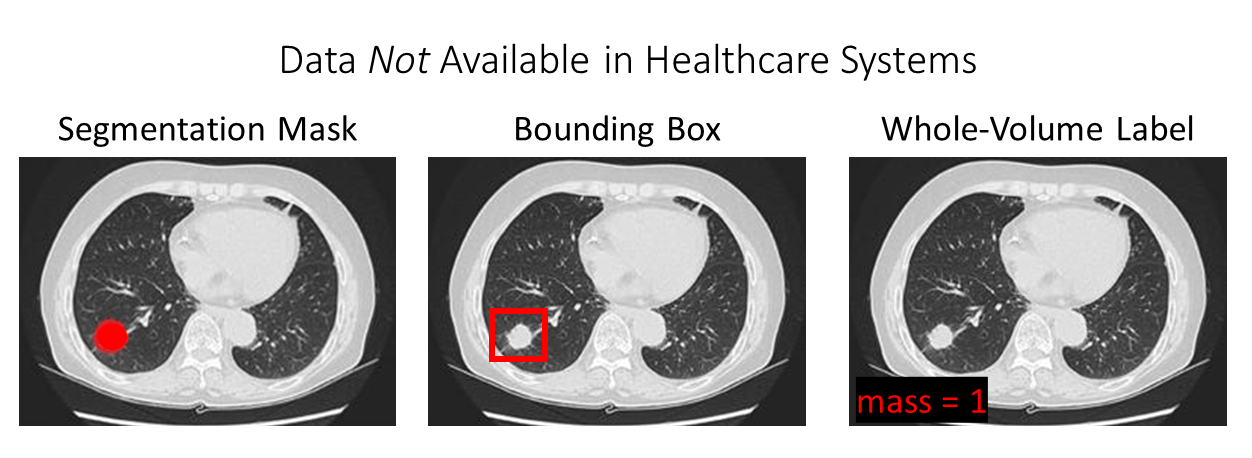
We also need to consider what kind of data is NOT available in healthcare systems:
Modified from mass image from SeattleCCA.org
Specifically, as shown in the figure above, at baseline we do NOT have access to:
- Segmentation masks: these are pixel-wise labels (“traced outlines around abnormalities of interest”) that are needed to train a segmentation model. Segmentation models for medical images are reviewed here.
- Bounding boxes: these are boxes drawn around abnormalities of interest that are needed to train an object detection model. Technically, radiologists will sometimes draw lines or other annotations directly on the images, which through extensive work can be turned into bounding box annotations suitable for training machine learning models (e.g. DeepLesion). However, a radiologist never annotates every abnormality in a single scan, and more than likely the radiologist will only annotate one representative instance of one type of abnormality in a scan (e.g. one nodule out of several nodules). So, comprehensive bounding box annotations of all abnormalities are never available.
- Whole-volume label: these are labels assigned to the entire volume needed to train a whole-volume classifier. One might think that hospitals would store “tags” on CT scans indicating for example whether a mass is present (mass=0 vs. mass=1). However, hospitals do not store this information. The only information available is the free-text report. In a future post, I will describe how to obtain structured whole-volume labels from free-text reports.
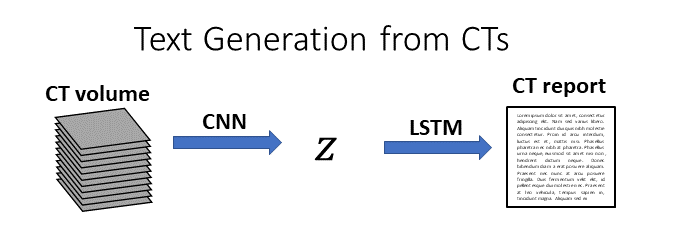
Possibility: Text Generation from CTs
Given that all we have is the volume paired with the report, one intuitive approach is to try text generation directly from the volume. In this setup, we would first process the CT volume into a low-dimensional representation (e.g. using a CNN), and then we would generate text from that low-dimensional representation (e.g. using an LSTM):
At present, I have not seen any studies on automatic generation of CT reports from volumes. There are several studies on automatic generation of chest x-ray reports, which is a more feasible task due to the much smaller size of chest x-rays (~1,000x smaller) and the much shorter length of chest x-ray reports (~6x shorter). However, even on this more straightforward task the models struggle to produce accurate reports. I suspect that this is partly because radiology reports include many “normal” sentences, so it is possible for a model to get a “good score” for a generated report that contains mostly normal sentences, even if that report messes up on the abnormalities – which happen to be the part that the doctors care the most about!
Although text generation from CTs might be an intriguing academic exercise, the main practical drawbacks of text generation from CTs are:
- A text generation model would have to be perfect to be used commercially. If there’s even one mistake out of every 10 notes, nobody would use the system because the potential cost of medical errors is too high, and the time needed to “check each report for correctness” is longer than the amount of time it would take to just dictate the report from scratch.
- Text generation models don’t inherently provide per-abnormality performance metrics, which is what radiologist need to see in order to trust the system. Some abnormalities are harder to detect than others, and the radiologists will want to know how good the model is at detecting each kind of abnormality.
A more practical route is to build a machine learning system that can predict the abnormalities and locations in a structured way. Then, we can have per-abnormality performance metrics and we can also highlight the location in the scan where each abnormality can be observed. Such a system could be used for automated triage (e.g. “move all scans with pneumothorax to the top of the radiologist’s queue”) and could be used in conjunction with a radiologist’s reading to try and increase diagnostic accuracy. Furthermore, a system that is good at predicting abnormalities and locations could also be used to generate text (if that is a desired goal). Given only a list of abnormalities and their locations, it is trivial to generate a basic free-text report using rules, because radiology language is highly structured.
Single Abnormality CT Classification
Due to the reasons listed in the previous section, there is a lot of interest in abnormality classification in CT images.
In single abnormality CT classification, a model (usually a CNN) processes a CT volume and produces a 0 or a 1 depending on whether a particular abnormality of interest is present or absent (i.e., binary classification):

All prior work in chest CT classification has focused on models that predict one abnormality or one class of abnormalities at a time. This prior work has relied on small, handcrafted data sets that have been painstakingly labeled by experts with patch-level or slice-level disease annotations.
Here is a table that I put together summarizing some of the prior work in prediction of interstitial lung disease from chest CT scans. The models shown here typically assign a single class label to each slice or patch, for a subcategory of interstitial lung disease:

Here is another table I put together summarizing additional prior work for prediction of other kinds of abnormalities in CT scans, including lung cancer, intracranial hemorrhage, and pneumothorax:

One advantage of training on patch- or slice-level annotations is that the resulting model will inherently provide patch- or slice-level localization.
One disadvantage of training on patch- or slice-level annotations is that these annotations are not available in the health system and must be acquired manually, which:
- limits the number of CTs that can be included in the data set (with the exception of the Ardila et al. and Kuo et al. studies, all of these papers use fewer than 1,200 CT scans);
- limits the number of abnormalities that can be considered (all studies shown consider <8 abnormalities).
Multiple Abnormality CT Classification
Although single-abnormality classification models can achieve high performance, they have inherently limited functionality. Hundreds of separate binary classifiers would be needed for comprehensive CT interpretation. An alternative framework for CT interpretation is multilabel classification, in which many abnormalities are predicted from one CT scan simultaneously. For a review of multiclass classification vs. multilabel classification, please see this post.
Multilabel abnormality classification proceeds as follows:
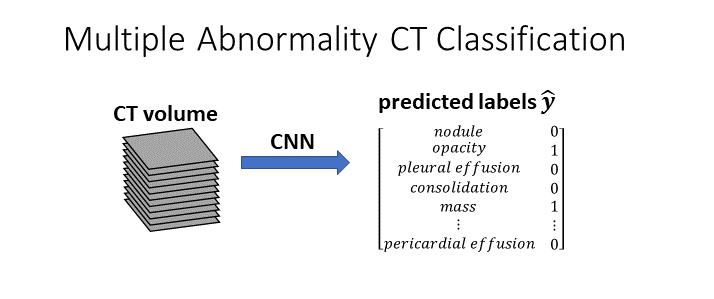
Each CT volume is assigned to one, many, or no classes.
Until my recent work the problem of multilabel chest CT classification had not yet been explored. Multilabel 2D chest x-ray classification, however, has been studied in depth, facilitated by the availability of large public datasets of chest x-rays with multiple whole-image labels:
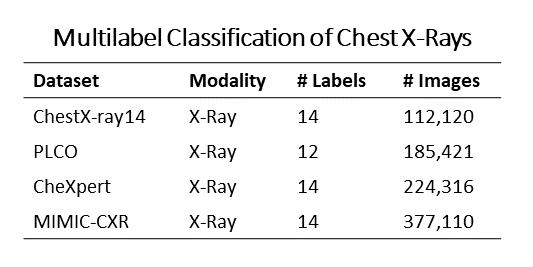
Inspired by this previous work on multilabel classification of chest x-rays, I have recently worked on multilabel classification of chest CTs. My work on multilabel chest CT classification has three parts:
- Preparation of a data set of 36,316 chest CT volumes from 19,993 unique patients. To the best of my knowledge, this is the largest multiply-annotated volumetric medical imaging data set in the world.
- Development of a rule-based method for automatically extracting structured abnormality labels from free-text radiology reports with an average F-score of 0.976. These structured abnormality labels are needed to train the classifier.
- Training and evaluation of a multi-organ, multi-disease convolutional neural network classifier that analyzes a whole CT volume to predict 83 abnormalities simultaneously. The model reaches an AUROC greater than 0.90 for 18 abnormalities, with an average AUROC of 0.773 for all 83 abnormalities.
In future posts, I will explore each of these directions in more detail: how to prepare a large CT data set of volumes and reports, how to extract structured labels from reports, and how to build a whole-volume CT classifier.
Additional Interesting Tasks on CT Data
A few more interesting tasks for CT data are:
- Object detection, in which a model predicts the coordinates of a bounding box around an abnormality of interest. Here, bounding boxes around abnormalities of interest are required for training and evaluation. An example of this task in CT scans can be found in the DeepLesion paper.
- Segmentation, in which a model predicts pixel-wise labels (effectively, “traced outlines of abnormalities).
- Registration, in which a model “aligns” two different scans so that the anatomical structures are in approximately the same place.
Summary
- Chest CTs are volumetric medical images composed of approximately 512 x 512 x 1000 grayscale pixels, that are acquired using an x-ray source and detector that rotate around a patient’s body.
- A radiologist interprets a chest CT by identifying the nature and location of all abnormalities present in the scan. The radiologist writes a report summarizing their findings.
- Hospitals store CT volumes and free-text reports, but not segmentation masks, bounding boxes, or structured whole-volume labels.
- Prior work in automated interpretation of CT scans has focused on identifying one class of abnormalities at a time, e.g. interstitial lung disease or intracranial hemorrhage.
- Recently, I curated a data set of 36,316 chest CT volumes, and built a multilabel classification model to predict 83 abnormalities from each whole volume.
- Additional tasks on CT volumes include object detection, segmentation, and registration.
About the Featured Image
The featured image includes stills from the scrollable CTs available on Wikipedia here, as well as the chest diagram available on Wikipedia here.
Want to be the first to hear about my articles bridging healthcare, artificial intelligence, and business—and get a free list of my favorite health AI resources? Sign up here.

Comments are closed.