

This post describes best practices for organizing machine learning projects that I have found to be highly effective during my PhD in machine learning.
Python
Python is a great language for machine learning. Python includes a bunch of libraries that are super useful for ML:
- numpy: n-dimensional arrays and numerical computing. Useful for data processing.
- pandas: data analysis library. pandas dataframes are essentially numpy arrays with descriptive strings as row and column labels. They can be sorted, filtered, grouped, concatenated, etc. Useful for data processing.
- PyTorch: build neural networks. Includes many pretrained models and clean computer vision datasets. PyTorch is my favorite library for neural networks because it encourages using object-oriented programming (a model is a class, a dataset is a class, etc.), writing code in PyTorch is quick, and PyTorch supports eager execution by default so it can be used with the Python debugger.
- TensorFlow: an alternative to PyTorch which is more popular in industry. A couple years ago I used TensorFlow, but after switching to PyTorch I have never looked back. I find PyTorch much better for research. If you want to use TensorFlow and you want a higher-level interface for it, you can use Keras.
- scikit-learn: this is a nice library for regression, SVMs, k nearest neighbors, random forests, calculating the area under the receiver operating characteristic, calculating confusion matrices, etc.
- matplotlib and seaborn: make lovely visualizations! I cover these libraries in a later section.
Git
Git version control is extremely useful for keeping machine learning projects organized.
Git is a tool that can be used to keep track of all changes that you make to your code. A Git “repository” is a directory containing your code files. Git uses space-efficient techniques so that it does not store multiple copies of your code but instead stores relative changes between old files and new files. Git helps keep your directory of code files clean and organized because only the most recent versions are “obviously” present (although you can easily access any version of your code at any time). You choose when to mark that changes have occurred, using a “commit” which bundles together specific changes to your code along with a written description that you provide. Git repositories also make it easy to share code and collaborate. On the whole, Git is a way better solution to preserving old code functionality than saving a million different versions of your code under “myscript_v1.py”, “dataprocessing_v56.py”, “utils_73.py” and so on.
Git version control is available through GitHub, GitLab, and Bitbucket to name a few. I use GitHub most frequently. Once you have GitHub set up and are used to using it, it takes about 2 minutes to set up a new repository.

Octocat, allowed for use in blog posts from GitHub Logos and Usage
Here are the steps to get GitHub set up on your machine:
- Install Git: https://git-scm.com/downloads
- Make a GitHub account www.github.com
- Link your GitHub account with your machine via an SSH key. This step enables you to push code from your machine to GitHub’s cloud storage. See Generating a new SSH key, Adding a new SSH key to your GitHub account
- Make a new repository on GitHub by clicking the green “New” button in the “Repositories” section of your profile.
- Enable your computer to push to that repository (note that GitHub will provide you with these instructions with the right URL for your repository immediately after you create the repository; the following commands are just an example):
echo "# pytorch-computer-vision" >> README.md
git init
git add README.md
git commit -m "first commit"
git branch -M master
git remote add origin https://github.com/rachellea/pytorch-computer-vision.git
git push -u origin master
Let’s say you have now changed some code in myeditedscript.py. To “commit” to the repository (i.e. log in that change):
git add myeditedscript.py
git commit -m 'added super useful functionality'
git push origin master
Anaconda
Anaconda is a package manager. It enables creation of different computing environments which may contain different Python versions and/or different packages and/or different package versions. Anaconda is especially useful when you are working on multiple projects that have conflicting dependencies.
Anaconda is easy to use. Steps:
First, install Anaconda: https://docs.anaconda.com/anaconda/install/
Next, create an environment. I find it useful to name the environment after the project that it’s for. For example, if the project is about chest x-ray classification using a neural network, the environment could be called chestxraynn:
conda create --name chestxraynn python=3.5 Note that you do NOT want to put quotes around the environment name, otherwise the quote characters themselves will be part of the environment name. Also, you can choose any version of Python that you want. It does not have to be Python 3.5.
Once the environment is created it is time to activate the environment. “Activation” merely means that you will be “put inside the environment” so that you can use all of the software that’s installed inside of it.
To activate the environment on Windows, run this command:
activate chestxraynnOn Linux or macOS,
source activate chestxraynnYou can install packages inside the environment using the “conda install” command.
For example, the conda command to install matplotlib is:
conda install -c conda-forge matplotlib
You can just Google “conda install packagename” to locate the page that tells you what conda command to run to install that package. Technically within a conda environment you can also install packages using pip, but this can cause issues and so should be avoided if possible.
Anaconda will take care of making sure that the versions of everything inside the environment are compatible. For more commands see the Conda Cheat Sheet.
It’s also possible to create a conda environment from a file that someone else has put together. In the GitHub repository https://github.com/rachellea/pytorch-computer-vision, there is a file called tutorial_environment.yml. This file specifies the dependencies needed to run the tutorial code. To create a conda environment based on this file, all you need to do is run the following command in the Anaconda prompt:
conda env create -f tutorial_environment.ymlOrganize Your Code: Classes and Functions
Code organization is very important. At various points in the past I have encountered research code that is thousands of lines crammed in one module, with no documentation, repeated chunks of code copied and pasted everywhere, some blocks of code commented out with no explanation, and weird variable names. The code doesn’t run, and even if it did run, it is probably not correct.
I have also encountered a lot of nice code – for example, all the code I have looked at in the PyTorch implementation is organized and well-documented.
It will save you a lot of time in the long run if you write good quality code for your own projects. One aspect of good quality code is its organization within a module.
Recommendations:
- Use object-oriented programming. I highly recommend PyTorch as a machine learning framework because it facilitates using object-oriented programming for everything. A model is a class. A dataset is a class. Etc.
- Use functions. If you’re writing something that wouldn’t work well as a class, then organize that code into functions. Functions are re-usable. Globs of code in the global namespace are not reusable.
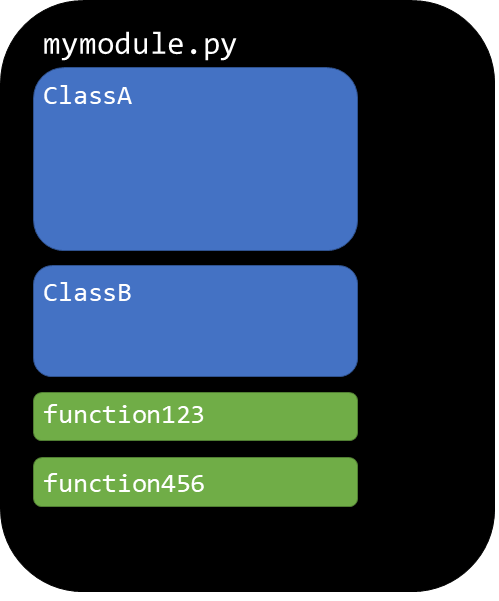
Schematic of organized code. Image by Author.
Organize Your Code: Directories
Use multiple modules to organize your code, and organize these modules into directories.
A simple example organization that I like is demonstrated in the GitHub repository that I put together for this post and other related posts: https://github.com/rachellea/pytorch-computer-vision
The overall organization is as follows:
- One module for the train/eval/test loop (src/run_experiment.py)
- One module for calculating performance metrics (src/evaluate.py)
- One module (or more) for data processing: (load_dataset/custom_pascal.py and load_dataset/custom_tiny.py)
- One module (or more) for models: models/custom_models_base.py
Here is the overall organization of the repository:
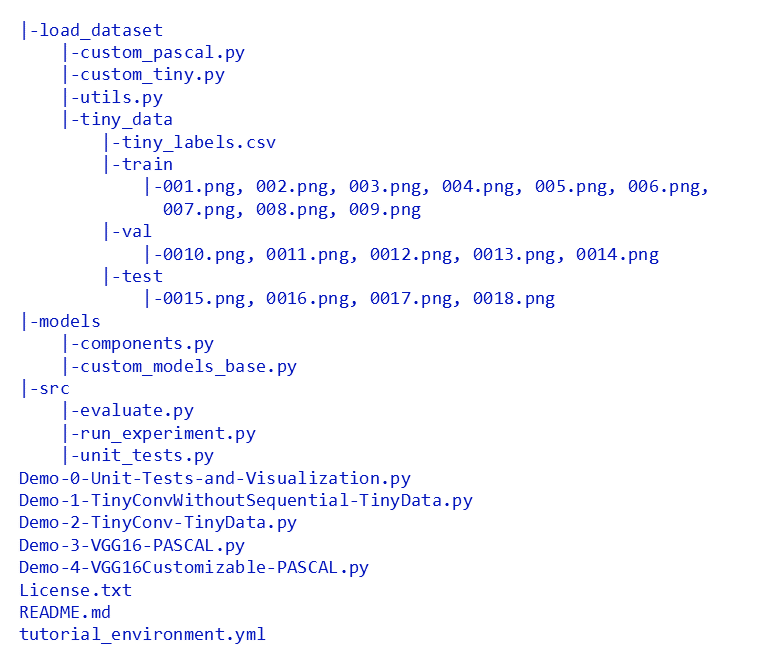
Organization of pytorch-computer-vision. Image by Author.
Note that while there is a data set stored in this repository (those PNGs in the directories “train”, “val”, and “test”) it is generally speaking not a good idea to put your data set into your repository. The only reason there is a data set in this repository is because it is a tiny fake dataset that was created for example purposes. Unless your data is very small, it should not go in the repository.
Importing
Note that you need an empty file called __init__.py in each of the subdirectories so that modules can import files from these directories.
Here is how to get a module called awesomecode.py to import a module called helpercode.py based on what directories they are located in relative to each other:
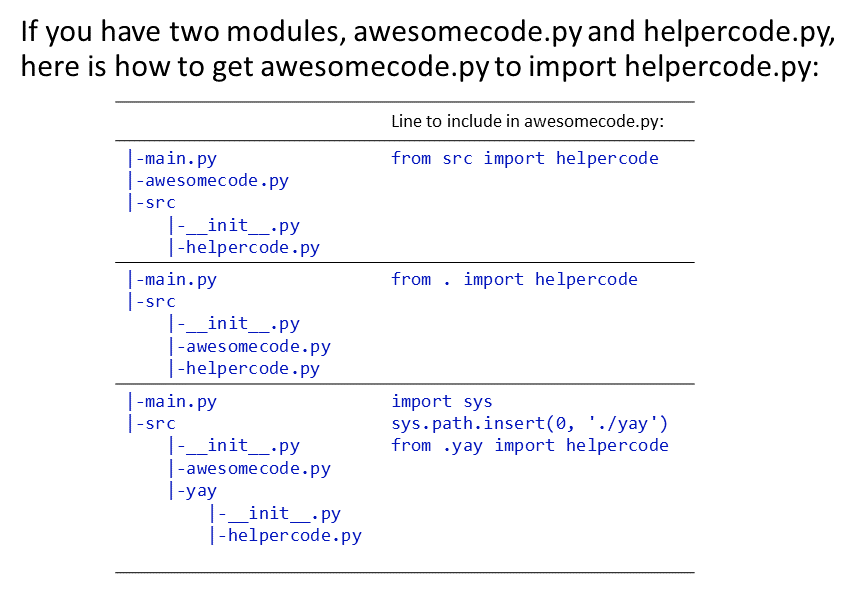
Image by Author
Documentation
It is good to write a lot of documentation. Comment everything. Document all your functions and methods and classes with docstrings. Sometimes it is helpful to document a function before you write it. It is also OK if the documentation is longer than the code sometimes. It’s better to be “overly clear” than not clear enough.
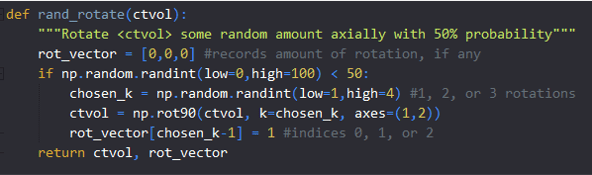
Image by Author
The image above is a simple function rand_rotate() that randomly rotates a 3D numpy array representing a CT volume. The docstring could be improved by specifying that <ctvol> is a 3D numpy array. The comments are helpful because they explain why the vector indicating what rotation was performed uses (k-1) – it’s because the chosen_k is 1, 2, or 3 but Python is zero-indexed. Simple comments like this can prevent confusion later.
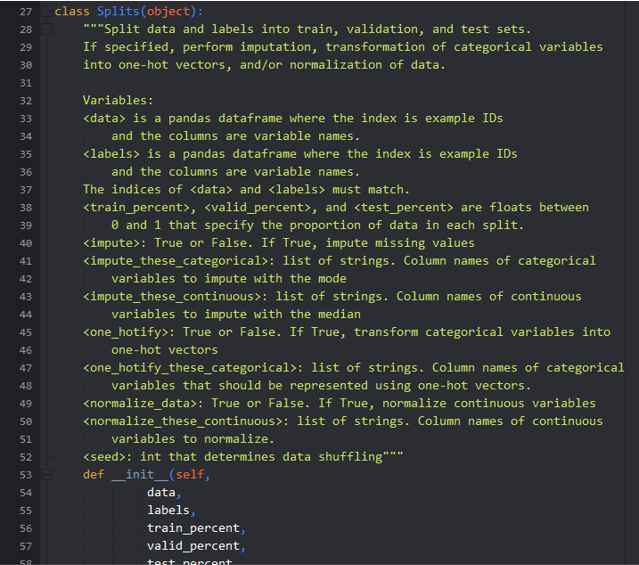
Image by Author
The image above shows documentation from some of my data processing tutorial code.
Documentation will ensure that when you look back on old code, you can quickly remember what it does. Documentation will prevent you from accidentally breaking your own code when you see something that looks weird and have the gut instinct to change it – if there’s a comment next to it explaining why the weird thing is necessary, you’ll leave it alone. Documentation will also enable other people to use your code.
Naming Variables
Always use descriptive variable names. “volumetric_attn_gr_truth” is a better variable name than “truth” (what truth?), and way better than “gt” or heaven forbid “g”. It is OK if your variables have long names. They should never ever have single-letter names.
Even if you are iterating over rows and columns, use “row” and “col” as your variable names instead of “i” and “j”. I once spent an entire day looking for a very weird bug that turned out to be caused by iterating over a 2D array incorrectly because I’d switched “i” and “j” in one line of code out of hundreds. That was the last time I use a single-letter variable name.
Unit Tests
A lot of people claim that they don’t have time to write tests for their code because “it’s just for research.” I would argue that it’s even more important to test research code, because the whole point of research is that you don’t know what the “right answer” is – and how can you know if you’ve reached the right answer if you don’t know whether your code producing the answers is correct?
Every time I have spent a day writing unit tests for my code, I have found mistakes – some of them tiny, and some of them more significant. If you write unit tests you will catch mistakes in your code. If you write unit tests for other people’s code, you will find mistakes in their code as well.
In addition to facilitating code correctness, unit testing also helps enforce good code organization, by discouraging you from writing “god functions” that do too many things at once. God functions are usually a nightmare to test, and should be broken down into smaller, more manageable functions.
At the very least, it’s a good idea to unit test the most critical parts of your code, e.g. complicated data processing or strange tensor rearrangements within a model. It is never a waste of time to make sure that your code is right.
You can see a very simple example of unit tests here. These unit tests include testing of some built-in PyTorch functions for demonstration purposes.
Checking Code with Visualizations
Especially in computer vision, it is useful to perform sanity checks using visualizations.
matplotlib is great for viewing images, segmentation maps, images with bounding boxes, etc. Here is an example of a visualization produced by applying matplotlib’s imshow() function to an input image:
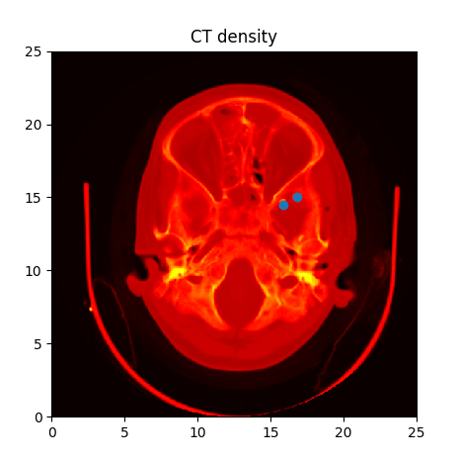
Example image produced by matplotlib imshow, from Image Demo. Matplotlib uses a BSD license which is a permissive free software license.
seaborn is designed for statistical data visualization. It is great for making heatmaps and for producing sophisticated visualizations of performance metrics. Here are some examples of plots that can be made with approximately one line of code in seaborn:
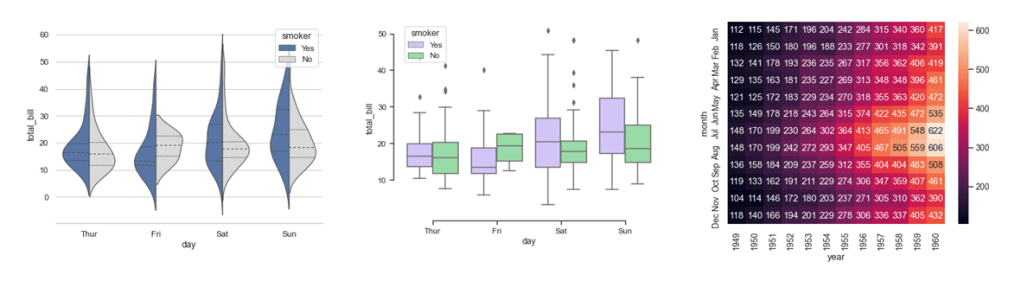
Example images produced by seaborn grouped violinplots, seaborn grouped boxplots, and seaborn heatmap respectively. seaborn uses a BSD license which is a permissive free software license.
Both matplotlib and seaborn can be used to create visualizations that display in an instant whether the input data looks reasonable, whether the ground truth looks reasonable, whether the data processing has proceeded without messing anything up accidentally, whether a model’s output makes sense, etc.
Demo 0: Unit Tests and Visualizations
In the tutorial repository, Demo-0-Unit-Tests-and-Visualization.py will run the unit tests in src/unit_tests.py and will then run visualizations of the PASCAL VOC 2012 dataset images and segmentation ground truth.
In order to run the visualization part of the demo, change the path in the Demo-0-Unit-Tests-and-Visualization.py to a path on your machine in which you can store the PASCAL VOC 2012 dataset and uncomment the line under the path to download the dataset. Once the dataset is downloaded you can run the visualizations. The code that makes the visualizations is in load_dataset/custom_pascal.py. At the moment, the total number of images_to_visualize is set to 3 in the demo file; if you want to visualize more images, you can increase that number further, e.g. to 100.
Here is what the visualizations look like:
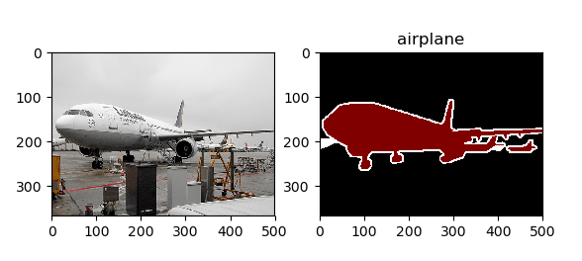
Image by Author. Original PASCAL VOC 2012 validation set image of an airplane.
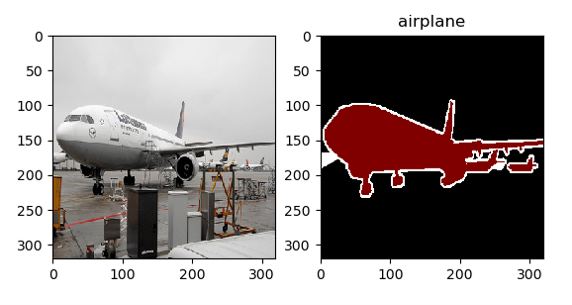
Image by Author. PASCAL VOC 2012 validation set image of an airplane that has been resampled to 320 x 320 pixels. The image resampling used torch.nn.functional.interpolate(mode=’bicubic’) while the segmentation ground truth resampling used PIL resize(resample=PIL.Image.NEAREST) i.e. nearest neighbors resampling.
From the visualizations we can infer several useful things:
- The mapping between the input images and the ground truth segmentations is correct.
- The mapping between the integers used to define the pixel-wise segmentation ground truth and the label descriptive strings is correct. e.g. 1 maps correctly to “airplane.”
- The resampling step did not “destroy” either the input image or the segmentation ground truth, or cause them to be severely misaligned.
Visualizations in Terminals
If you are in a “non-interactive environment” (i.e. a terminal with no graphical user interface) then you will need to turn off interactive plotting and save your figures so you can open them elsewhere:
import seaborn
import matplotlib
matplotlib.use('agg’)
import matplotlib.pyplot as plt
plt.ioff()

#seaborn figure:
heatmap = seaborn.heatmap(some_dataframe, cmap = 'Blues', square=True, center=0)
heatmap.get_figure().savefig('Descriptive_Figure_Name.png',bbox_inches='tight')
plt.close()

#matplotlib figure:
plt.imshow(chest_x_ray,cmap='gray')
plt.savefig('Other_Descriptive_Figure_Name.png')
plt.close()
The Python Debugger
The Python debugger is an extremely useful tool, because it allows you to inspect everything in the state at the place where your program crashed, and run snippets of code at the place where your program crashed so you can try out possible solutions. Using the Python debugger is way more efficient than debugging with print statements, and it will save you hours and hours of time. The Python debugger can also be used with PyTorch; you can inspect tensors, gradients, logging dataframes, etc.
To run a script interactively in a terminal using the Python debugger, use the following command:
python -m pdb myscript.pyYou will see a (Pdb) prompt show up. Type
cto continue. (Yes, that is just a lone lowercase letter c, for continue).
To get out of the Python debugger, use
q(that is a lone lowercase letter q, for quit).
You may have to use q twice to fully quit.
If you want to stop at a specific point in your program, then within the relevant module you can import pdb and then put “pdb.set_trace()” at the specific point where you want to stop. Or, if you don’t want to bother importing pdb, you can just write “assert False” at the place you want to stop and that will guarantee the program dies where you want it to (although that is not the official way to use the Python debugger).
Don’t Use Jupyter Notebooks
Given all of the previous sections, I must now recommend never using jupyter notebooks for machine learning projects, or really for any coding project that’s going to take you longer than a couple days.
Why?
- Notebooks encourage you to keep everything in the global namespace, which produces one gigantic monster module that does everything, and has no functions, no classes, and no structure whatsoever.
- Notebooks make it more difficult to re-use your code. Functions are re-usable; “code in cells 5, 10, and 13” is not re-usable.
- Notebooks make it difficult to unit test. Functions and methods can be unit tested. “Code in cells 5, 10, and 13” cannot be unit tested.
- The more organized your code is (i.e. the more subdivided into classes and functions), the less interactive the notebook becomes – and the interactivity is the main reason people like notebooks. The appealing interactive property of notebooks is inherently in opposition to highly structured, well-organized code.
- Notebooks make it difficult to properly use Git version control. Notebooks are just massive JSON files so properly merging them or doing pull requests with them is essentially impossible.
- Notebooks make it difficult to collaborate with others. You have to “take turns” working on the notebook (rather than pushing/pulling from the same repo as you could with “regular code”).
- Notebooks have a non-linear workflow, which is completely in opposition to reproducible research. You should not have to “run the cells in a particular order” to reproduce someone else’s work.
What are notebooks good for? Some possibly acceptable use cases are initial data visualization, homework assignments, “presentation-style” software, and interactive demonstrations. (However, I argue that all of those can also be accomplished without using jupyter notebooks.)
I am not the only person in existence who believes that it is better to avoid jupyter notebooks for machine learning projects. For further reading/reference, see Why I don’t use Jupyter notebooks and you shouldn’t either by Daoud Clarke; 5 reasons why jupyter notebooks suck by Alexander Mueller; and The Notebook Anti-Pattern by Kristina Young.
Goals
Two useful goals are:
- To write code that is correct and understandable. If your code is correct, it’s more likely that your model will produce good results, that your research conclusions will be correct, and that you will create something practically useful.
- To ensure that anyone can replicate everything you did – e.g. your model, its results, the figures – by running one command in a terminal (e.g. “python main.py”). This will help others to build on your work and will also help “future you” to build on your own work.
Summary
- Python is an excellent language for machine learning
- Git version control helps keep track of different versions of code. It is available through GitHub.
- Anaconda is a package manager that enables creation of different environments which may contain different Python versions and/or packages. It is useful when working on multiple projects that have conflicting dependencies.
- Organize your code into classes and functions within a module. Organize modules in a hierarchical directory structure within a Git repository.
- Document your code with comments and docstrings
- Use descriptive variable names. Never use single-letter variable names.
- Write unit tests, especially for the most complicated or critical parts of the data processing and model.
- Visualize your data set, model output, and model performance using matplotlib and seaborn visualizations
- Use the Python debugger for fast, efficient debugging
- Do not use jupyter notebooks for machine learning projects
Happy machine learning-ing!

Smiling cat from Wikipedia, Creative Commons License
Want to be the first to hear about my articles bridging healthcare, artificial intelligence, and business—and get a free list of my favorite health AI resources? Sign up here.

Comments are closed.