
This post could also be called “everything I learned during the first year of my PhD while working with a massive electronic health record data set.” Here, I’ll overview the difference between categorical and quantitative variables, and I’ll explain how to prepare tabular data for a neural network model, including:
- proper representation of categorical variables (intro to one-hot vectors)
- normalization of continuous variables
- filling in missing values (intro to imputation)
Best of all, broadly-applicable code is provided to do all of the above on your tabular data! You can download the code for this tutorial on GitHub: rachellea/glassboxmedicine/2019-06-01-dataprocessing.py.
Categorical Variables
A categorical variable is a variable that takes on different category names. Here are some examples of categorical variables:

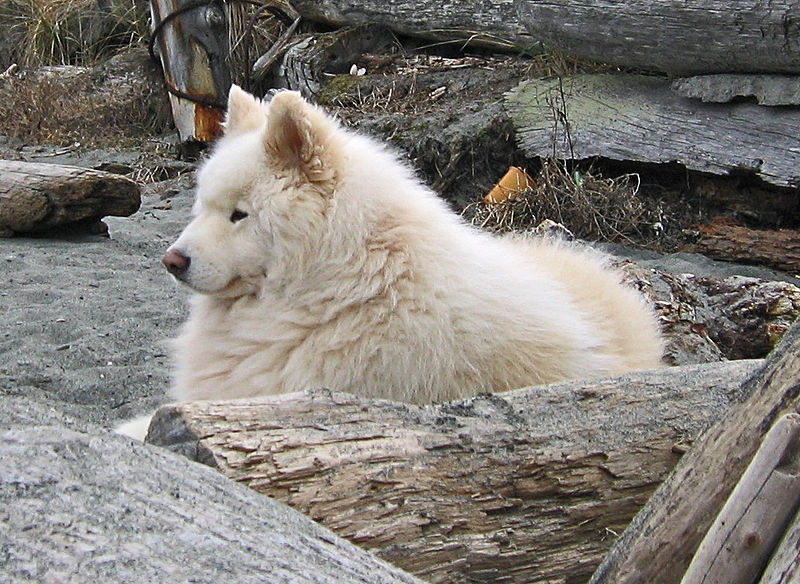
Image credits: fruit, london, beach dog
Categorical variables are further subdivided into nominal and ordinal variables:
- Nominal variables have no natural ordering among the categories. The examples above (fruit, location, and animal) are “nominal” variables because there is no inherent ordering among the categories.
- Ordinal variables have a natural ordering. For example, letter grades (A, B, C, D, F) or ranking scales (pain on a scale of 1 – 10) are ordinal variables.
Nominal Categorical Variables in Medicine
Here are some example nominal variables (no natural ordering) in medical data sets, along with some example values:
- gender: female, male
- race: American Indian or Alaska Native, Asian, Black or African American, Hispanic or Latino, Native Hawaiian or Other Pacific Islander, White
- diagnosis: diabetes, hypertension, hyperlipidemia, lung cancer, pneumonia, myocardial infarction, lupus, irritable bowel syndrome, stroke
- procedure: appendectomy, cholecystectomy, mastectomy, CABG*
- medication: acetaminophen, alprazolam, amitriptyline, amlodipine, amoxicillin, atorvastatin
- laboratory test: complete blood count (CBC), prothrombin time (PT), basic metabolic panel (BMP), comprhensive metabolic panel (CMP), lipid panel, liver panel, hemoglobin A1c (HbA1c)
*Side note: CABG stands for “coronary artery bypass graft” which is a type of open-heart surgery. Doctors pronounce this abbreviation “cabbage” (seriously).

cabbage, not to be confused with CABG
Ordinal Categorical Variables in Medicine
Here are some examples of ordinal variables (inherently ordered) in medical data sets:
- Pain on a scale of 1 – 10
- Grading systems for cancer, e.g. grade 1, grade 2, grade 3, grade 4
- Gleason grading system for prostate cancer
- Bethesda score for Pap smear results or thyroid cell specimens
Mnemonic:
- ORDinal variables are ORDered
- NOMinal variables are NOMS (names) only, with NO order
Quantitative Variables
Quantitative variables have numerical values that usually represent the result of a measurement. There are two kinds of quantitative variables:
- Discrete variables take on a countable number of values. Examples: number of prescriptions a patient takes, number of diseases a patient has been diagnosed with, number of surgeries a patient has had
- Continuous variables take on any value within a particular range of values. Examples: height, weight, body mass index, tumor diameter, waist-hip ratio
Side Note on Lab Tests
If your variable is the NAME of a laboratory test, then that’s a nominal (categorical) variable because the values it can take on are different names of different lab tests, e.g. “Complete Blood Count,” “Basic Metabolic Panel,” “Complete Metabolic Panel.”
If your variable is the RESULT of a laboratory test, it could be:
- Categorical/Nominal: e.g. color in a urinalysis
- Quantitative/Discrete: e.g. count of the number of white blood cells
- Quantitative/Continuous: e.g. blood glucose level. Most lab test results fall into this category because they are the result of a measurement of some substance (in the blood, cerebrospinal fluid, urine, etc.)
Representing Categorical Variables: One-Hot Vectors
In machine learning, categorical variables are typically represented as “one-hot vectors.” A one-hot vector is a vector where all the entries are zero except for one, i.e. only one element is “hot” (nonzero). Here are some one-hot vectors:
- [0,0,0,0,1]
- [0,1]
- [1,0]
- [0,0,1,0,0,0,0,0,0,0]
- [0,0,0,0,0,0,0,0,0,0,0,0,0,0,0,0,1,0,0,0,0,0,0,0,0,0,0,0,0,0,0]
What’s cool about one-hot vectors is that they allow you to represent your categorical variables without assuming any particular relationship between them.
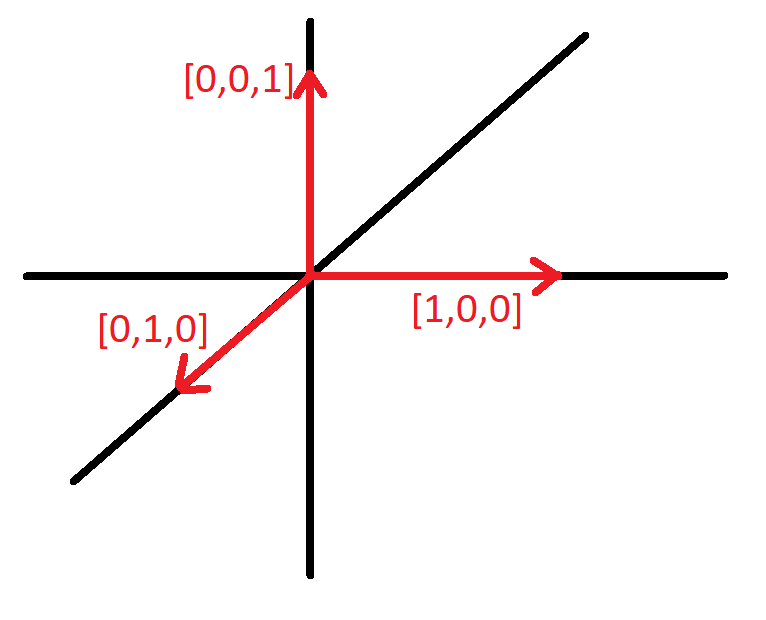
Let’s say you wanted to represent the categorical variable “animal” which takes on values dog, cat, and fish.
- If you said dog = 1, cat = 2, and fish = 3, that implies a dog is one-third of a fish, and a cat is twice a dog, and all sorts of other numerical relationships that don’t make sense.
- However, if you say dog = [1,0,0], cat = [0,1,0], and fish = [0,0,1], you haven’t made ANY assumptions about the relationships between these animals because those one-hot vectors are perpendicular:
If you had 20 different animals you wanted to represent, that’s no problem: just use one-hot vectors of length 20. The resulting 20 different one-hot vectors are STILL perpendicular to each other, in a 20-dimensional space (which, you will be gratified to know, I will not attempt to sketch):
- dog [1,0,0,0,0,0,0,0,0,0,0,0,0,0,0,0,0,0,0,0]
- cat [0,1,0,0,0,0,0,0,0,0,0,0,0,0,0,0,0,0,0,0]
- fish [0,0,1,0,0,0,0,0,0,0,0,0,0,0,0,0,0,0,0,0]
- horse [0,0,0,1,0,0,0,0,0,0,0,0,0,0,0,0,0,0,0,0]
- lizard [0,0,0,0,1,0,0,0,0,0,0,0,0,0,0,0,0,0,0,0]
- etcetera
In general, the length of the one-hot vector you need is equal to the number of different possible values your categorical variable can take on. If it can take on 5 values, the one-hot vector should be length 5. If it can take on 1,298 values, the length of your one-hot vector should be 1,298.
What if I have many categorical variables in my data set?
Just make a different one-hot vector for each categorical variable. Let’s say you took a survey and asked 3 people for their favorite animal, location, and fruit. In the end, your data set of survey responses includes the categorical variables “animal” (3 possible values), “location” (4 possible values), and “fruit” (2 possible values). Thus, you should:
- represent “animal” using a one-hot vector of length 3
- represent “location” as a separate one-hot vector of length 4
- represent “fruit” as yet another one-hot vector of length 2
Visualized,

What if my categorical variable can take on multiple values at the same time?
What if in the previous survey you gave people the option of choosing multiple animal(s), location(s), or fruit(s)? You can use a “multi-hot vector” which is exactly the same as a one-hot vector except more than one entry can be equal to 1. Here’s an example (modified from the previous example; the additional entries are highlighted in yellow):

Categorical variables that can take on more than one value like this are common in medicine. For example, diagnoses, procedures, and medications extracted from a patient’s medical record over ten years are likely to take on more than one value. Many patients will have several past diagnoses, several past procedures, and several past medications. Thus, you will need a multi-hot vector for diagnoses, another multi-hot vector for procedures, and another multi-hot vector for medications.
Here’s a snippet of the provided code that transforms each categorical variable into a one-hot or multi-hot vector as appropriate, using the pandas function get_dummies():

Representing Quantitative Variables: The Importance of Normalization
(i.e., “How to Feed Your Neural Network”)
Now we are going to switch gears and talk about representing quantitative variables. It seems like you could just throw these variables straight into the model without any extra work, because they’re already numbers. However, if you’re building a neural network model, you don’t want to feed in raw quantitative variables because they will likely have very different scales, and giving a neural networks numbers of different scales will make it sad (i.e. it will be more difficult for the neural network to learn anything.)
What I mean by “different scales” is that some variables may take on small values (e.g. tumor diameter = 0.5 cm) and others variables may take on large values (e.g. weight = 350 pounds.) A neural network will train more effectively if you feed it only small, normalized values.
Here’s a common procedure for normalizing a quantitative variable before training a neural network:
- Split your data into training, validation, and test sets
- Calculate the mean of your quantitative variable in the training set
- Calculate the standard deviation of your quantitative variable in the training set
- Normalize every original value of your quantitative variable across ALL your data (train, validation, and test) using the mean and standard deviation you just calculated on the training set:

You must do this separately for each quantitative variable in your data set (e.g. separately for “tumor diameter” and “weight”), because each quantitative variable will have a different mean and a different standard deviation.
The effect of performing the above steps is that all your quantitative variables will now be represented as small numbers centered on 0, which will make them good food for your neural network.
Why do we calculate the mean and standard deviation using ONLY the training set? Why not use the entire data set? Answer: If we included the test set in our calculation of mean and standard deviation, we would be leaking information about the test set into our training data, which is cheating.
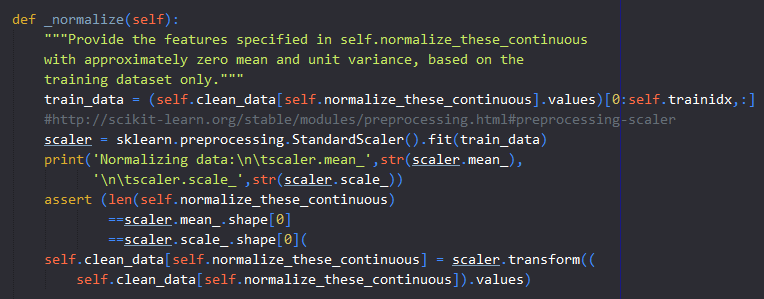
Here’s a snippet of the provided code that normalizes continuous variables, using StandardScaler from scikit-learn:
Imputation to Deal with Missing Data
Frequently, data values are missing. Perhaps a survey participant didn’t answer all the questions or a patient received care in a different state and their diagnoses, procedures, and medications didn’t make it in to their local medical record.
If we read in a data file with missing values, these values will be “NaNs”, or “not a number.” We have to replace them with a number in order to train. Filling in missing values is called “imputation.”
There are different strategies for imputation. Here’s one reasonable strategy:
- Replace all missing values for a categorical variable with the training set mode. Thus, if the mode (most commonly chosen value) for animal is “dog,” we replace all of the missing answers to “What is your favorite animal?” with “dog”
- Replace all missing values for a continuous variable with the training set median. Thus, if the median height is 5.2 feet, we replace all of the missing entries for “height” with 5.2.
Here’s a snippet of the provided code that performs imputation of missing values, using the pandas function fillna():

Conclusion
Data preparation is critical to achieve good performance in machine learning methods. It took me a few months during the first year of grad school to gather all of the information contained in this blog post, so I hope that aggregating it here and providing my code will help you in preparing your own interesting data sets :).
About the Featured Image
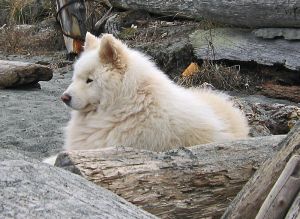
The featured image is a Samoyed dog, which happens to be my all-time favorite kind of dog. This dog made a cameo appearance in the “example categorical variables” table. Fun facts about Samoyeds:
- Samoyeds were bred by nomadic reindeer herders in Siberia
- Samoyeds are one of the oldest dog breeds
- Shed Samoyed fur can be used to knit clothing
- Due to their thick coats, Samoyeds can stay nice and warm in temperatures well below freezing
Want to be the first to hear about my articles bridging healthcare, artificial intelligence, and business—and get a free list of my favorite health AI resources? Sign up here.

Comments are closed.