

Confusion matrices are calculated using the predictions of a model on a data set. By looking at a confusion matrix, you can gain a better understanding of the strengths and weaknesses of your model, and you can better compare two alternative models to understand which one is better for your application. Traditionally, a confusion matrix is calculated using a model’s predictions on a held-out test set.
This is a confusion matrix:
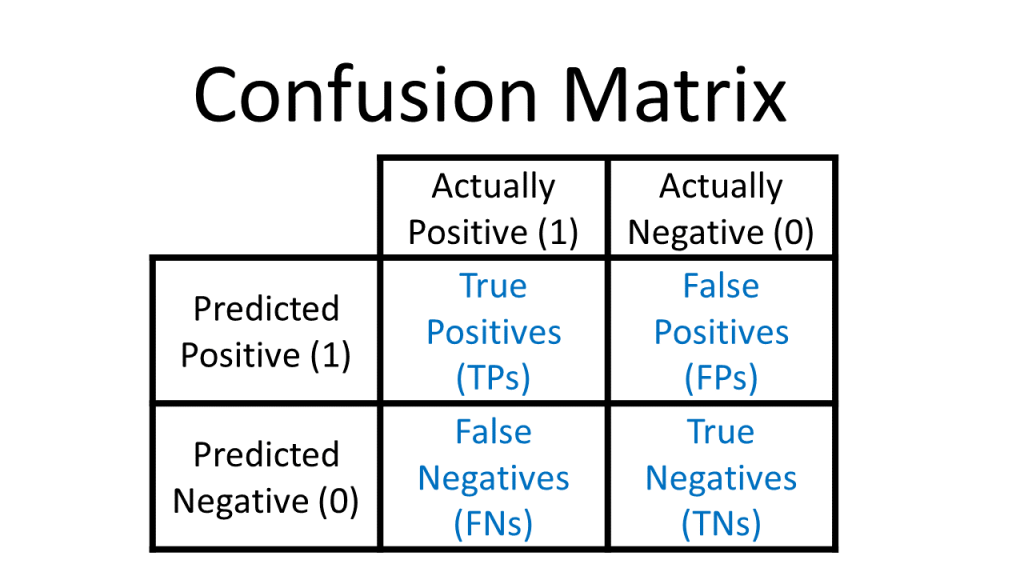
The column labels “Actually Positive” and “Actually Negative” refer to the ground-truth labels in your data set, i.e. whether a handwritten digit is truly a 1 or a 0, whether a patient was truly diagnosed with a disease (1) or not (0), whether a chest x-ray actually shows pneumonia (1) or not (0), etc.
The row labels “Predicted Positive” and “Predicted Negative” refer to your model’s predictions, i.e. what your model thinks the label is.
Note that the entries inside of a confusion matrix (TPs, FPs, FNs, TNs) are counts:
- True Positives (TPs): the number of positive examples that the model correctly classified as positive
- True Negatives (TNs): the number of negative examples that the model correctly classified as negative
- False Positives (FPs): the number of negative examples that the model incorrectly classified as positive (i.e. the negative examples that were falsely classified as “positive”)
- False Negatives (FNs): the number of positive examples that the model incorrectly classified as negative (i.e. the positive examples that were falsely classified as “negative”)
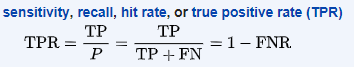
True Positive Rate and False Positive Rate
You can use a confusion matrix to calculate the true positive rate (TPR) and false positive rate (FPR). The TPR and FPR will be needed later on to calculate the area under the receiver operating characteristic (AUROC), a popular performance metric.
True Positive Rate = True Positives / All Positives = True Positives / (True Positives + False Negatives)
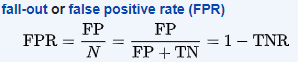
False Positive Rate = False Positives / All Negatives = False Positives / (False Positives + True Negatives)
i.e.
 (ref)
(ref)
(In the above formulas, FNR = false negative rate and TNR = true negative rate, which are other quantities you can calculate from a confusion matrix.)
Precision
You can also use a confusion matrix to calculate the precision. The precision, along with the true positive rate (also known as “recall”), will be needed later on to calculate the area under the precision-recall curve (AUPRC), another popular performance metric.
Precision = True Positives / (True Positives + False Positives)
i.e.
 (ref)
(ref)
Decision thresholds
Decision thresholds allow you to translate predicted probabilities into predicted labels. If your model outputs probabilities, you must use a decision threshold to transform those probabilities into predicted labels. Once you have the predicted labels, then you can calculate a confusion matrix. You will also need predicted labels to calculate AUROC and AUPRC, calculated using different decision thresholds.
A “decision threshold” is just the number you choose to compare to a probability to decide if that probability should indicate the positive class or the negative class.
A common decision threshold is 0.5, which means any probability smaller than 0.5 is considered as part to the negative class, and any probability greater than 0.5 is considered belonging to the positive class.
However, in practice you can choose any decision threshold you want. You could make your decision threshold 0.99, so that an example has to have a predicted probability greater than 0.99 to be considered “positive”. This means that the majority of your examples are going to be considered negative.
Extreme Decision Thresholds
If you choose a decision threshold of 0, every example will be considered positive:
- That means each example is either a true positive or a false positive
- The true positive rate will be 1 (TPR = TP / (TP + FN) but FN = 0, so TPR = TP/TP = 1)
- The false positive rate will be 1 (FPR = FP / (FP + TN) but TN = 0, so FPR = FP/FP = 1)
- The value of the precision will depend on the skew of your data. If there are an equal number of actual positives and actual negatives in the data set, the precision will be 0.5 (precision = TP / (TP + FP) = 50 / (50+50) = 0.5). If there are many more actual positives, the precision will be greater than 0.5; if there are many more actual negatives, the precision will be smaller than 0.5.
If you choose a decision threshold of 1, every example will be considered negative:
- That means each example is either a true negative or a false negative
- The true positive rate will be 0 (TPR = TP / (TP + FN) but TP = 0, so TPR = 0)
- The false positive rate will be 0 (FPR = FP / (FP + TN) but FP = 0, so FPR = 0)
- Technically speaking, the precision will be undefined (precision = TP / (TP + FP) = 0/0)
How to choose a decision threshold
Your choice of decision threshold depends on the downstream application of your model.
Example: in certain medical applications, false negatives may be worse than false positives, e.g. in automated classification of dermatology photos, you don’t want to miss a case of melanoma. In this case you want to choose a lower decision threshold so that you classify more examples as positive, which will lower your false negative rate but increase your false positive rate.
Example: imagine a society where a predictive model is used to decide whether criminals should be convinced or set free. In this case, a false positive may be worse than a false negative, e.g. it would be awful if the model falsely determined that an innocent person was guilty and sent that person to prison. (Thankfully this scenario is still in the realm of dystopian sci-fi, at least for the moment…)
The AUROC and AUPRC curves can also help you visualize the trade-offs induced by different decision thresholds, and can help you choose a good decision threshold for your model’s downstream application.
Other names
- The true positive rate is also called sensitivity, recall, or hit rate
- The precision is also called the positive predictive value (PPV)
More details on the confusion matrix
Wikipedia has a great article on confusion matrices. It includes more details about other quantities that can be calculated from a confusion matrix, including the specificity (aka selectivity or true negative rate) and the negative predictive value.
Stay tuned for future posts about the AUROC and AUPRC, which are both very useful performance metrics for machine learning models.
As an independent researcher (MD + AI PhD + 7 yrs prior founder/CEO experience), I build and evaluate cutting-edge healthcare AI for startups. Contact me to learn more.
Want to be the first to hear about my articles bridging healthcare, artificial intelligence, and business—and get a free list of my favorite health AI resources? Sign up here.

Comments are closed.