

The term “medical data” is a huge umbrella that includes everything from images to free text and comes from many sources, including electronic health records, insurance claims, clinical trials, patient and disease registries, health surveys, phone apps, and wearable electronics[1]. This post is a quick overview of the “what” of medical data collection. Future posts will dive into the details of “why,” “how,” and “when” specific data are collected; “who” collects them; and how data science has been (or could be) applied. Without further ado…
Monitoring Data
Vital Signs: Periodic measurements of vital signs are commonly available in electronic health records. Continuous streams of vital signs are also occasionally measured, e.g. for critically ill patients or patient undergoing anesthesia for surgery. The vital signs are[2]: pulse rate, temperature, respiratory rate, blood pressure, and oxygen saturation (there’s argument about whether oxygen saturation should philosophically be considered a “vital sign”, but regardless it’s typically measured along with all the others). O2 saturation is measured through pulse oximetry[3], which passes two different wavelengths of light through a body part such as the fingertip or earlobe to estimate oxygen levels. A pulse oximeter:

Electroencephalograms (EEGs): Electroencephalograms are electric measurements of brain waves, commonly used in diagnosis of epilepsy (seizures). They are also used for diagnosis of sleep disorders, and estimation of anesthesia or coma depth.
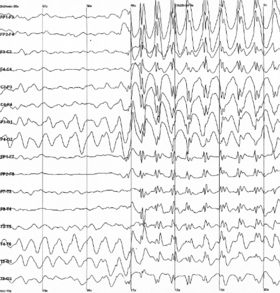
Here’s an EEG showing signs of epilepsy.
Electrocardiograms (ECGs, EKGs): Electrocardiograms measure the electrical activity of the heart. They can provide information on the position and thickness of heart attacks, as well as characterization of arrhythmias (such as atrial fibrillation, where the top chambers of the heart contract so quickly they cannot pump blood well anymore.) Two great resources to better understand EKG interpretation are Rapid Interpretation of EKGs (book) and Life In The Fast Lane (blog). An EKG:

Cardiotocography (electronic fetal monitoring): Cardiotocography[4] is recording of the fetal heartbeat and uterine contractions during pregnancy. It is commonly used in obstetrics to monitor the fetus’ well-being. Features monitored include uterine contractions, fetal heart rate, fetal heart rate variation (accelerations, decelerations), and trends over time. If the electronic fetal monitoring indicates that the fetus is in distress, it can lead to critical medical interventions such as a C-section.
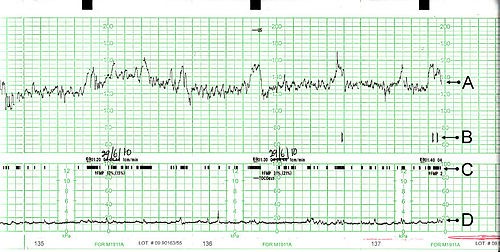
A cardiotocogram, where A is fetal heartbeat, B is indicator showing fetal movements as reported by the mother pressing a button, C is fetal movement detection, and D is uterine contractions.
Inputs and Outputs: As described here, “inputs” are fluids that go in to a patient, including food/drink consumed, food/drink delivered through a tube, and IV solutions delivered through a needle inserted into a blood vessel. “Outputs” are fluids that leave a patient, either through natural excretion (e.g. urine) or extraction (e.g. through a catheter or wound drain.)
App/wearable data: Information about physical activity, sleep, heart rate, energy expenditure, and other physiologic variables can be collected continuously with wearable devices.
Written Notes
Physician notes:Any time a patient goes to a physician, the physician writes a note about the patient. Medical notes are highly structured and typically include several sections, such as:
- History of Present Illness (HPI): the story – what brought the patient here today?
- Past Medical/Surgical History (PMH, PSH): any previous hospitalizations, illnesses, or surgeries
- Family History (FH): major health conditions and/or causes of death of family members
- Social History (SH): alcohol and drug use, smoking or tobacco use, social situation, sexual history, work history, recent travel, etc.
- Review of Systems (ROS): extensive review of all organ systems
- Physical Exam: written description of physical findings summarizing the doctor’s examination of the patient
- Assessment and Plan: discussion of probable diagnoses and treatment plan
If a patient is hospitalized, the physician writes a note about them every day with updates on their progress and care plan. If the patient is at a teaching hospital, every day there can be (a) a note from the medical student, (b) a note from a resident, and (b) a note from the attending physician (the boss).
Here are some example physician notes as well as tips (directed at medical students) for how to write notes, which reveal some of the thought process behind medical note writing:
A Practical Guide to Clinical Medicine: Write Ups
Additional medical notes:The physician note is only one kind of note written about a patient. There are also nursing notes, consult notes (from “consulted physicians” e.g. cardiology, psychiatry, infectious disease, surgery), physical therapist notes, occupational therapist notes, etc. For a hospitalized patient at a major academic medical center, essentially any clinical person involved in the patient’s care will leave a note in the health record.
Laboratory Tests
Blood tests: Blood tests are used in the diagnosis and management of a huge range of disorders. There are hundreds of different blood tests that can measure levels of small molecules, ions, hormones, cells, proteins, etc.
Urine tests (e.g. urinalysis):[5] The results of urine testing can be used in diagnosis of kidney and bladder disorders, e.g. blood in the urine is associated with kidney stones and tumors, or bacteria and white blood cells associated with urinary infections.
“Omics”: Clinical whole-genome or whole-exome DNA sequencing (WGS or WES) is becoming more common. The actual sequence data is often available if it was collected as part of a clinical trial or research project, but in an electronic health record typically only a high-level PDF summary of the major results is available. Other DNA tests include SNP panels (looking at single nucleotide polymorphisms, i.e. single-base mutations) and focused sequencing for a particular gene of interest. Metabolomics measures levels of different small molecules, and proteomics measures levels of different proteins.
Medical Imaging: Visible Light
Photographs (macroscopic):Normal color photographs taken with cameras or phones are often used to document:
- skin lesions (dermatology / dermatopathology)
- wound healing after surgery
- gross pathology (gross as in “big”, e.g. a photograph of a large tumor that has just been removed in an operation)
- colposcopy (images of the cervix e.g. as part of follow up of abnormal Pap smear results)
- retinal imaging (picture of the back of the eye)
- any visible physical finding of particular interest/importance
Some physicians have secure apps installed on their phones that allow them to photograph an important visual physical exam finding and securely upload it into the patient’s medical record.
Histopathology (microscopic) [11]: Histopathology refers to examination of thin slices of tissue underneath a microscope. To create a histopathology image, there are several steps:
- Obtain a piece of tissue, via surgery, biopsy, or autopsy
- “Fix” the tissue, i.e. preserve it with chemicals
- Further process the tissue, by cutting it into extremely thin slices and staining it with chemicals that highlight particular features. There are hundreds of different chemical stains. The most commonly used stain is H&E (hematoxylin and eosin). The hematoxylin stains cellular nuclei blue, and the eosin stains other parts of the cell pink.
- Photograph the tissue with a light microscope

Giant cell tumor of bone, stained with H&E.
Medical Images: X-Ray-based
Note: The website Radiopaedia.org is a great resource for understanding different kinds of radiology findings and technologies. They have many example scans with interesting findings labeled and explained.
Projectional radiographs/x-rays[6]: These are 2D still images obtained by shining x-rays through a person’s body. X-rays are a form of electromagnetic radiation with a shorter wavelength than visible light. X-ray images are useful for investigating skeletal problems (e.g. broken bones), checking on implants (such as a hip replacement), and checking placement of lines and tubes (e.g. an endotracheal tube for delivering air to the lungs). Chest x-rays can be used to detect pneumonia, lung cancer, pulmonary edema (fluid in the lungs), and other conditions. Abdominal x-rays can be used to detect bowel obstruction, free air (caused by perforations in organs), ascites (free fluid, e.g. caused by liver problems), and other conditions. There are several public x-ray data sets available including:


Wilhelm Rontgen’s first “medical” X-ray, of his wife’s hand. The giant blob on the fourth finger is his wife’s wedding ring.
Fluoroscopy[6]: This is a type of 2D video x-ray in which a contrast liquid is used to gain further insight into a possible medical problem. Examples include cardiac catheterization in which contrast liquid is injected into the bloodstream to look for heart blockages, and barium swallows in which a patient drinks a bad-tasting smoothie containing barium to check for esophageal/swallowing disorders.

A barium swallow showing an abnormally large esophagus (the giant white blob in the center of the image is the esophagus filled with contrast.)
Computed Tomography (CT)[6]: These are 3D images obtained by shining x-rays through a person’s body and then doing a computational reconstruction to create cross-sectional images. CTs are extremely versatile and can be used to assess tumors, bleeding in the brain, lung disease, blood vessels, the heart, abdominal disease, and fractures, among other applications. Here is an example of a normal abdominal CT scan from Radiopedia.org. You can scroll back and forth through the different slices just as a radiologist would do when writing a report. There are several public CT data sets available including

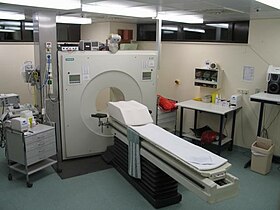
A CT scanner.

Medical Imaging: Magnet-Based
Medical Resonance Imaging (MRI)[7]: Magnetic Resonance Imaging uses strong magnetic fields to generate images. Similarly to CT imaging, MR imaging has a huge array of different uses, including imaging of the brain, the heart, the muscles, and the abdominal organs. MRI uses the same technology as nuclear magnetic resonance (NMR, e.g. as used for determining chemical structures), but people figured that a scan with the word “nuclear” in the name wasn’t very appealing, so the technology was called “MRI” instead of “NMRI.” The MRI Wikipedia article has a table (under the section “T1 and T2”) that describes the biological meaning of the color scale in MRI.
Here are some fun YouTube videos illustrating how powerful the MRI magnets are (a good reminder not to carry any metal into MRI rooms): How dangerous are magnetic items near an MRI magnet? and MRI vs Chair
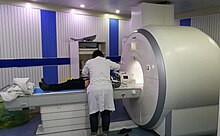
An MRI scanner.
Medical Imaging: Sound
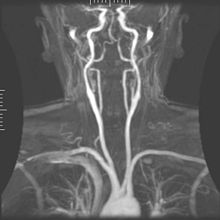
Ultrasound (US)/Sonography [8]: Ultrasound uses high-frequency sound waves (>20,000 Hz) to create images. It is most famous as the imaging method of choice for examining fetuses throughout pregnancy, as it does not involve any ionizing radiation. Ultrasound also has many uses beyond pregnancy, including:
- Guiding needles for anesthetic injection or biopsies
- Guiding vascular access (e.g., guiding the placement of a catheter into a blood vessel); diagnosing blood vessel diseases
- Echocardiography, i.e., imaging of the heart, which is used to assess size, shape, and contractility of the heart muscle and heart valves
- Emergency medicine scans, e.g. the “FAST” exam to check for internal bleeding
- Abdominal/pelvic imaging, e.g. of liver tumors, the appendix, the urinary bladder (e.g. to quantify urinary retention), the kidneys, etc.
- Head and neck imaging, e.g. of the thyroid gland which sits at the front of the neck below the “Adam’s apple”
- Imaging a baby’s brain through the soft spots in the skull to check for structural problems or bleeding
Doppler ultrasonography allows measurement of flow; typically the resulting output video is displayed with colors that indicate the direction of flow.

Kidney ultrasound. The dark kidney-bean-shaped silhouette in the center of the image is the kidney.
Medical Imaging: Radiation (Nuclear Medicine)
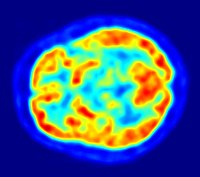
Positron Emission Tomography (PET) [9]: PET is used to visualize metabolic processes. It detects gamma ray emissions from a radioactive tracer. A radioactive tracer is a biologically active molecule containing a positron-emitting radionuclide such as fluorine-18 (positron-emitting = Positron Emission Tomography.) The emitted positrons annihilate with electrons, causing two gamma photons to be emitted in opposite directions.
One common PET tracer is fludeoxyglucose, which acts like sugar in the body and can be used to detect highly metabolically active tissue. PET imaging is commonly used to detect the spread of cancer, as areas of cancer “glow” due to high sugar consumption.
A PET scanner.
Single-photon Emission Computed Tomography (SPECT) [10]: SPECT is similar to PET, except that the SPECT tracers emit gamma rays directly (whereas PET tracers emit positrons that then produce gamma rays.) SPECT scans are less expensive than PET scans. The images are acquired by rotating the gamma camera around the patient. SPECT can be used for myocardial perfusion imaging (observing blood moving through the heart muscle), and functional brain imaging.
Conclusion
We’ve finished the “What” of medical data! With such a variety of data available, the data science possibilities are nearly endless, from using EEGs to predict seizures[12], to using smartphones to predict sleep apnea[13] and mental health[14]. Stay tuned for future posts which will delve into the above topics in much more detail, including more background on the medicine and more background on related data science research!
Refs:
[1]J. Rich, “Library Guides: Data Resources in the Health Sciences: Clinical Data.”
[2]“Vital Signs (Body Temperature, Pulse Rate, Respiration Rate, Blood Pressure) | Johns Hopkins Medicine Health Library.” [Online]. Available: Link [Accessed: 09-Oct-2018].
[3]“Pulse oximetry (Wikipedia).” [Online]. [4]“Cardiotocography (Wikipedia).”; [5]“Clinical urine tests (Wikipedia).”; [6]“Projectional radiographs (Wikipedia).”; [7]“Magnetic resonance imaging (Wikipedia).”; [8]“Medical ultrasound (Wikipedia).”; [9]“Positron emission tomography (Wikipedia).”; [10]“Single-photon emission computed tomography (Wikipedia).”; [11]“Histopathology (Wikipedia).”
[12]T. N. Alotaiby, S. A. Alshebeili, T. Alshawi, I. Ahmad, and F. E. Abd El-Samie, “EEG seizure detection and prediction algorithms: a survey,” EURASIP J. Adv. Signal Process., vol. 2014, no. 1, p. 183, Dec. 2014.
[13] M.-H. Tseng, H.-C. Hsu, C.-C. Chang, H. Ting, H.-C. Wu, and P.-H. Tang, “Development of an Intelligent App for Obstructive Sleep Apnea Prediction on Android Smartphone Using Data Mining Approach,” in 2012 9th International Conference on Ubiquitous Intelligence and Computing and 9th International Conference on Autonomic and Trusted Computing, 2012, pp. 774–779.
[14] D. Ben-Zeev, E. A. Scherer, R. Wang, H. Xie, and A. T. Campbell, “Next-generation psychiatric assessment: Using smartphone sensors to monitor behavior and mental health.,” Psychiatr. Rehabil. J., vol. 38, no. 3, pp. 218–26, Sep. 2015.
Want to be the first to hear about my articles bridging healthcare, artificial intelligence, and business—and get a free list of my favorite health AI resources? Sign up here.
